

The S&P 500 just cleared a critical technical level-erasing every loss since late February when U.S.-Iran tensions first escalated. Today's move wasn't just another green day; it was a clean breakout that changes the chart structure.
The index closed up roughly 67 points, nearly 1%-adding over $400 billion in market cap on a similar recent strong session. That's the kind of volume-backed move that signals genuine buyer conviction. The war zone is behind us, technically speaking.
But here's what matters for the next leg: the S&P 500 is now testing all-time high resistance. A clean break above this zone signals continuation-the bulls have cleared the war-related overhead supply and the path of least resistance stays higher. Failure here, though, tells a different story. It would suggest the late-March selloff (when the index dropped over 9% from its January high) created a higher-low structure instead of a true recovery. That's the key technical tension right now.
The Nasdaq-100 showed relative strength today, jumping 1.5% versus the S&P's 1% as of early Tuesday afternoon. That outperformance isn't accidental-it's concentration risk wearing a bullish mask. The Magnificent 7 now carry 65% weight in the Nasdaq-100 but only 38% in the S&P 500 according to index weighting data. When these seven stocks lead, the Nasdaq runs. When they stumble, the broader market gets left behind.
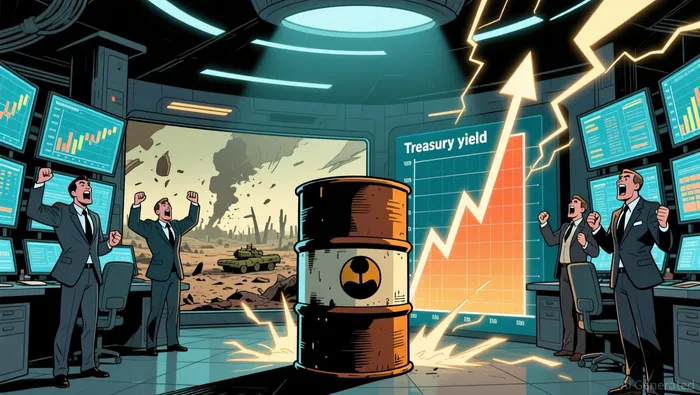
Oil prices sit 40% higher than pre-war levels. Treasury yields have climbed on inflation concerns. Rate cut expectations have largely vanished. These are the fundamental headwinds waiting at the all-time high line. The price action says buyers are stepping up. The fundamentals say the battlefield has shifted.
Earnings Engine: 19% Growth Supports Higher Valuations
The fundamental chart shows even stronger support than the price action does. S&P 500 companies are expected to deliver 19% earnings growth in 2026, up from 15% just before the war began, according to LSEG IBES data. That's a 400-basis-point acceleration in the earnings trajectory-the fundamental equivalent of a volume-backed breakout.
For technical traders, this matters more than the news headlines. Price can fake out. Earnings don't lie. A 19% growth rate provides a real fundamental floor beneath today's valuations, even with oil 40% higher and Treasury yields climbing on inflation fears. The market isn't just betting on peace-it's pricing in profit growth that exceeds what was expected heading into the conflict.
The financial sector test came today. Goldman Sachs reported mixed results-fixed income trading revenue fell 10% year-over-year after the company's first-quarter, a clear signal of market volatility impacting trading desks. But investment banking fees spiked and overall profit still beat expectations. That's the key: despite rate uncertainty and geopolitical noise, banks are finding revenue streams. The profit growth narrative holds.
Here's the technical read: the 19% earnings growth is the fundamental support level. If price holds above the all-time high zone, that's a confirmation-the bulls have the fundamentals behind them. If earnings disappoint in the coming quarters, that support erodes. For now, the profit engine is firing. The breakout has fuel.
Risk Factors: Three Things That Break the Rally
The bullish structure holds-for now. But every breakout has its invalidation point. Here are the three scenarios that break this rally, viewed through supply and demand mechanics.
Oil above $100 breaks the fundamental support. Crude sits 40% higher than pre-war levels, hovering around $95 a barrel the front-month contract. A sustained spike above $100 changes the game. It pressures consumer spending directly through higher gasoline prices and hits business margins through elevated transportation and production costs. More critically, it reinforces inflation concerns that have already ruled out Fed rate cuts. The market's pricing a temporary disruption-December crude sits at $77 according to LSEG data-but if the conflict extends or expands, that near-term spike becomes a structural shift. The technical trader watches $100 like a key resistance level. Break above and hold, and the fundamental floor cracks.
Treasury yields compress valuations at the worst possible moment. Rate cut expectations have largely vanished according to market participants. Higher yields mean higher discount rates, which compress present values-especially for growth stocks. The Nasdaq-100's 1.5% outperformance today as of early Tuesday afternoon looks risky in this context. When yields climb, the Magnificent 7-carrying 65% weight in the Nasdaq versus 38% in the S&P 500-become vulnerable. A sustained yield spike above key technical levels would force a re-rating. Watch the 10-year. If it breaks above recent highs with volume, growth stocks face a supply wall.
Geopolitical complacency is the biggest risk of all. The market has priced in a short-lived conflict-an "off-ramp" as one investment officer put it. That's a fragile bet. If Iran re-escalates, if the ceasefire collapses, the "temporary risks" narrative breaks. The S&P 500 closed essentially flat since late February despite today's gains, meaning the entire war-related rally is paper profit. A renewed shock would test the higher-low structure formed during the late-March selloff. Does it hold, or does it break back below the war zone? That's the technical question.
Sector rotation signals both opportunity and concentration risk. Energy is up nearly 29% over six months but pulling back now as tech and clean energy pick up the slack. That rotation typically signals risk-on sentiment-but it also concentrates exposure in the Magnificent 7. When these seven stocks lead, the Nasdaq runs. When they stumble, the broader market gets left behind. The technical trader sees this as a double-edged sword: strong relative strength today, but vulnerable to a sharp reversal if the fundamental headwinds intensify.
The bullish thesis holds if: oil stabilizes below $100, yields don't spike further, and the Iran situation doesn't re-escalate. Break any of these three, and the all-time high resistance becomes a ceiling. The price action says buyers are in control. The risk factors say the battlefield has shifted. Watch for the supply shift.
What to Watch: Catalysts and Levels
The breakout is valid. Now we test conviction. Here are the four technical watchpoints for the next 1-2 weeks.
Magnificent 7 momentum check. Alphabet, Nvidia, and Amazon led today's advance with gains of 3.12%, 2.85%, and 3.98% respectively. These three alone added roughly 350 points to the Nasdaq-100. If they continue leading over the next few sessions, the Nasdaq-100 has the relative strength to test new highs. The 65% weight concentration means these seven stocks are the engine-if the engine fires, the index moves. Watch for any session where the Magnificent 7 fail to lead. That's your early warning signal.
Key support: the late-February gap. The S&P 500 closed essentially flat since late February when the Iran war began. The index dropped over 9% from its January high in late March, then rebounded. The gap left during that selloff is the critical support zone. Hold above it confirms the "buy the dip" structure. Break below and the higher-low pattern invalidates-the war zone becomes a ceiling, not a floor.
Volume profile confirms buyer conviction. Today's gain added an estimated $500-800 billion in total market cap based on the average percentage gains. That's the kind of volume-backed move that signals genuine participation. Sustained volume above recent averages over the next 3-5 sessions confirms the breakout has fuel. Declining volume on up-days would signal weakening conviction-a potential trap at the all-time high line.
Catalyst sensitivity test. Any Iran-related headlines will be immediately discounted-the market has already priced in a short-lived conflict. The real signal is the reaction (or lack thereof). If negative headlines fail to move the market, the "off-ramp" narrative is intact. If the market rallies on bad news or sells off on good news, sentiment has shifted. That's your true sentiment gauge.
The technical setup is clear. Watch these four levels. Hold them, and the bullish structure extends. Break them, and the all-time high resistance becomes a ceiling.