
Asteroid Shiba (ASTEROID) has plummeted 32.2% in the last 24 hours, retreating from an all-time high near $0.0004694 to $0.00031216 according to market data. This sharp correction follows a staggering 567,675% gain achieved over a seven-day period, resulting in a market cap contraction of approximately $58.8 million as reported. The decline is characterized by a critical volume anomaly where trading volume reached $74.4 million, representing 56.6% of the current market cap according to analysis.
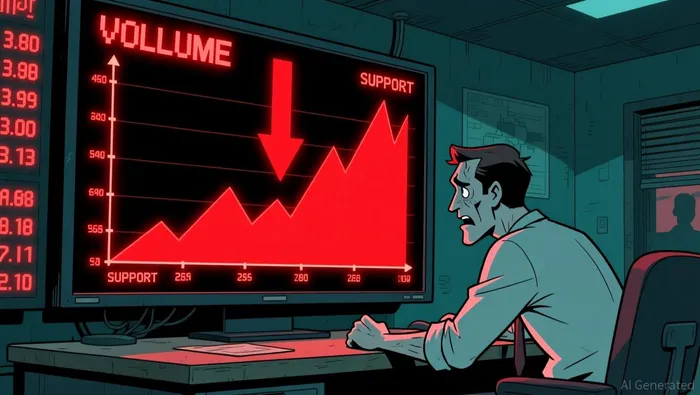
In healthy markets, volume typically ranges between 10% and 30% of market cap, making this ratio exceptionally high according to market indicators. Ratios exceeding 50% historically correlate with coordinated profit extraction or significant market maker repositioning rather than organic retail panic as data shows. The sharp 6.5% decline observed in the last hour confirms elevated selling pressure with no clear support level established according to trading analysis.
The token's supply structure involves a fixed 420.69 billion tokens with no locked supply to dampen volatility according to market reports. This means market cap movements directly reflect price action and capital extraction by early holders who purchased at prices 1,000 times lower as detailed. Historical data indicates that assets gaining 500,000%+ in 30 days typically retrace 60% to 85% before stabilizing according to analysis.
What Are The Key Support Levels For Asteroid Shiba?
Support levels are critical to monitor around the $0.00020 to $0.00025 range, representing the 50-61.8% Fibonacci retracement zones according to technical analysis. A breakdown below this zone could accelerate selling pressure toward the $0.0001 level as observed. The current 32.7% decline from the peak may represent only the beginning of a larger correction cycle according to market forecasts.
For traders, the risk-reward ratio has shifted unfavorably as downside potential now exceeds near-term upside according to market data. Stabilization below $0.0003 with declining volume is required before considering new entry points as recommended. Analysts suggest waiting for three consecutive days of volume below 30% of market cap to signal selling exhaustion according to technical indicators.
Implement a long-only Mean Reversion strategy for ASTEROID over the past 2 years. Entry: price closes above 0.00031216 and RSI(14) < 30. Exit: price closes below 0.00020, or after 20 trading days, or TP +5%, SL -10%.
Why Is The Volume-To-Market-Cap Ratio So High?
The 56.6% volume-to-market-cap ratio signals a coordinated exit strategy by institutions or whales rather than typical retail panic according to market analysis. This volume dynamic suggests that early investors are extracting life-changing profits, creating asymmetric sell pressure against recent buyers as reported. The lack of fundamental utility and the extreme gains for early holders create a risk of continued selling pressure according to technical assessment.
Security warnings indicate the creator retains the ability to disable sells, change fees, and mint tokens according to project documentation. The asset lacks a formal governance structure or official affiliation with SpaceX or Elon Musk according to analysis. This reliance on external narratives and social media momentum is a key vulnerability for the token as noted.
What Are The Risks Associated With This Meme Token?
The token faces significant contract risks, including the potential for rug pulls common in the meme space according to risk assessments. Analysts warn that such rapid gains often precede corrections, and the long-term value hinges on sustained community engagement according to market analysis. Rising Bitcoin dominance is currently diverting liquidity away from speculative assets like meme coins according to market data.
While the contract is verified on Etherscan, investors are advised to treat this as a high-risk bet according to market warnings. The project's value proposition relies on its thematic tie-in to current events rather than inherent business value according to analysis. Long-term success is not guaranteed as many meme tokens fade after initial pumps according to market reports.
For risk-tolerant traders, allocating only 5% to 10% of a portfolio to such assets and monitoring on-chain activity for whale movements is a prudent strategy according to investment guidance. The article suggests that for beginners, starting with small positions or paper trading is recommended to understand market cycles without risking significant capital as advised. The token's future evolution remains speculative as it lacks a traditional roadmap or utility-focused whitepaper according to market analysis.
While the token retains a rank on CoinGecko, the high volume-to-market-cap ratio suggests sustainability concerns according to market data. The current market structure reveals a bifurcated holder base with early investors holding astronomical gains according to analysis. This dynamic creates a scenario where early holders have minimal incentive to hold through volatility as observed.