Bitcoin near $62K is testing demand, not just support
This is a demand test more than a chart exercise. Bitcoin may be trading around $61,928.70 today, after a 22.73% one-month drop. The latest demand read was the most severe weekly decline in demand since January 2022. Bulls can still point to support. Bears see the simpler problem: buyers are not showing up at scale.
Why $53,600 matters
The level keeping the bear case from running away is Bitcoin's realized price, near $53,600. That figure reflects the aggregate onchain cost basis of all participants and has often served as a reference point in major drawdowns. But a floor is not the same thing as demand. Analysts say buying pressure has not yet returned, which means this level still needs to be defended rather than assumed to hold.
What prediction markets are signaling
The odds show how cautious the market remains. Prediction markets imply only a 1% chance of Bitcoin hitting $150,000 by June 30, with odds improving to 7% for the end of 2026. They still show a 61% chance of Bitcoin reaching $90,000 by the end of 2026. That points to a fragile setup: not a clean rebound, but still a scenario where a longer-term recovery case exists. Until fresh buying pressure appears, $53,600 looks more like backup support than proof that the bottom is in.
ETF outflows and long-term holder selling are keeping pressure on price
Bitcoin spot ETFs reversed course in May
The cleanest institutional bull case still rests on one idea: once fear cools, ETF flows will turn positive again. For now, that remains a hypothesis. Bitcoin spot ETFs closed May with $2.30 billion in net outflows, the largest monthly outflow of 2026. Since May 14, the pressure has kept coming, with over $4.8 billion in net outflows and only one day with net inflows.
Bulls can argue this is simply post-peak digestion, especially after two consecutive months of green inflows earlier in the year. Bears have the stronger read today. If the institutions that once provided steady demand are pulling cash, price support cannot be assumed. It has to be bought again.
Long-term holders are adding supply
The more dangerous signal is that supply is coming from wallets the market usually trusts to hold through stress. In the past 30 days, investors who had held Bitcoin for at least 155 days sold roughly 143,000 BTC. Glassnode described that as the most aggressive divestment since August, reversing a brief accumulation phase seen in late December and early January.
That changes the setup. This is not just a short-term momentum break. When long-term holders distribute while ETF demand weakens, the market loses support from two places at once. Bears can point out that prior long-term selling eventually gave way to higher prices. But that was during a stronger trend. Today, the market has weakened demand across spot, futures, and institutional ETF markets, which makes any historical rebound less automatic.
What would show the floor is holding
The next few sessions matter more than another debate about support zones. If ETF flows flip back to consistent net inflows and long-term holder selling cools from the roughly 143,000 BTC sold in the past month, the market may be absorbing supply cleanly. If not, the realized price remains backup support, not proof that the bottom is in.
June's seasonal edge only matters if Bitcoin reclaims momentum
The setup is now a trading map. June gives bulls a historical tailwind with a median return of +2.58%, but that seasonal edge only matters if price can force the market to chase. Until then, this is still a test of whether Bitcoin can absorb supply or keep yielding to it.
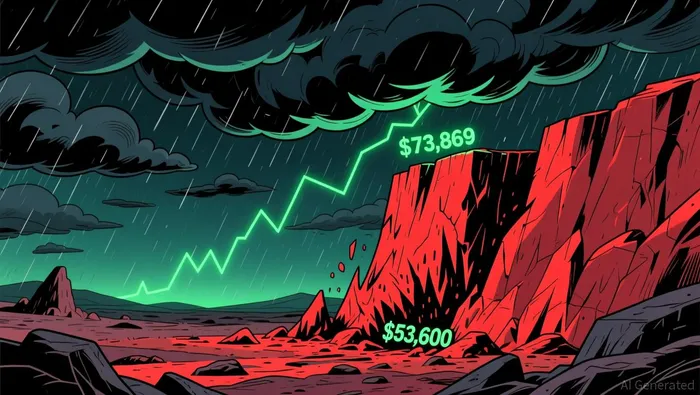
Bullish trigger: reclaim $73,869
The clean signal is a reclaim of $73,869. That level marks the line between seasonal buyers taking control and distribution still running the tape. If Bitcoin reclaims it, the market starts proving that post-pullback demand is strong enough to override the recent flow unwind.
Bearish path: failure keeps the pressure on
If Bitcoin cannot win back that upper zone, the downside picture gets clearer. A slide toward $68,348 would suggest sellers still control the market and that price is still digesting ETF caution and holder distribution rather than attracting fresh money.
What would invalidate the near-term bearish map
This setup is narrow because the opposing signals are close together. History points one way, while the largest monthly outflow of 2026 and long-term holder distribution point the other. That leaves a limited window for a rebound to matter before bears can argue the drawdown is still unfolding.
This is not a watch-and-see market. It is either starting to bid aggressively or it is still giving sellers the higher bid.