

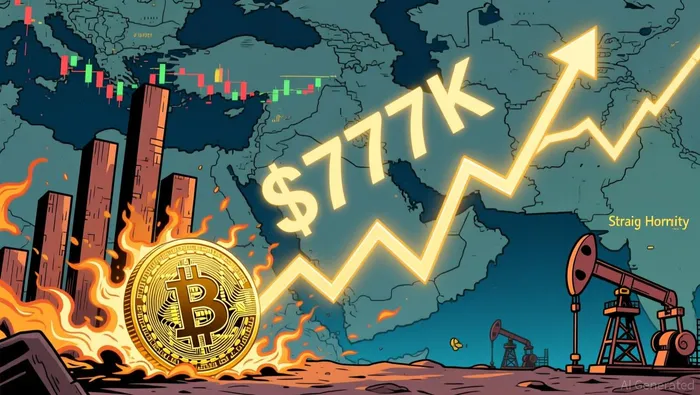
Bitcoin's $77K bounce looks like a liquidity trade, not a regime change
Bitcoin's 5% move toward as high as $77,700 showed traders are still chasing a squeeze, not celebrating a clean "digital gold" breakout. Price is now near $77.2K, just above the 50-day average of around $76,940. That is enough to keep the bullish squeeze narrative alive, but not enough to prove a durable trend change.
What bulls and bears are watching
- Bulls: Bitcoin is the strongest-looking major crypto on this metric, holding above its 50-day average while Ether, XRP, and Solana remain below theirs. Combined with heavy short liquidations, that favors fast upside if macro headlines keep improving.
- Bears: Caution remains justified. The same CoinDesk report notes ETF outflows exceed $2 billion in two weeks, which suggests demand is not fully confirmed yet.
Why waiting for perfect confirmation can be costly
Trump said the US-Iran agreement is moving closer to finalizing, and markets have already started pricing easier conditions. If that window opens further, the next leg higher could be driven by short covering and fast risk-on flow before spot demand fully validates.
Oil risk and positioning still matter more than the safe-haven narrative
This move matters less as a "safe-haven" signal than as a macro-relief trade. Bitcoin has been tracking crude with a 0.68 positive correlation with WTI, which suggests the market is still pricing energy risk first and the digital-gold story second. If Hormuz headlines improve enough to ease oil pressure, BTC can still move sharply on sentiment. If the truce wobbles, that reaction can reverse just as quickly, with headline risk driving short-term swings.
Leverage is the amplifier
Positioning makes this setup especially sensitive to fast moves. Just before the rebound, roughly $6 billion in clustered shorts sat above the market near the $72.2K-$73.5K zone. In that kind of setup, a modest relief move can force bears to cover, and that covering can fuel the next leg. That helps explain why the bounce was strong enough to trigger heavy short liquidations even though the underlying conflict was not fundamentally resolved.
The trade map: hold the 50-day to stay constructive, respect $72K
Here the debate stops being theoretical and becomes a level game.
Bullish confirmation
The first test is simple: does Bitcoin stay above the 50-day simple moving average of around $76,940? Right now, it is holding above that line. If price can push from there toward $80,000, it would suggest shorts are getting squeezed faster than sellers can reload.
The key detail is not just direction, but conviction. A real breakout needs the move to stick after the latest liquidation wave, not fade back into the same range. That matters because the setup is still tied to the Iran conflict and Bitcoin's 0.68 correlation with crude. If oil keeps cooling, the tape can keep working.
Why $72K matters more than another headline bounce
If Bitcoin loses the $72K area, caution is warranted. Recent price action showed what happens when support breaks: BTC dipped to $70,741 and then traded around $71,937, with the market still hanging over a potential drag back toward $70,000. In plain terms, $72K is where traders decide whether this is another range squeeze or the start of a deeper flush.
That is especially important with ETF outflows exceed $2 billion in two weeks. If demand is still leaking, failed breaks matter more and bears need fewer catalysts to press each rally.
The three triggers that matter now
- Bullish: Bitcoin stays above the 50-day average and retests $80,000.
- Neutral-to-bearish: Price chops below the 50-day but still defends the low-$72K area.
- Bearish: Bitcoin loses $72K and exposes the $70K area again.
For now, the cleaner read is to respect the squeeze while support holds. If those levels break, this looks less like a new regime and more like a flow trade losing momentum.