

Bitcoin is testing a critical structural floor at $72,204, having fallen roughly 23% from its January high. This decline marks its first back-to-back quarterly losses since 2022, setting up a tense battle between institutional inflows and leveraged risk. The immediate catalyst was the collapse of a two-week U.S.-Iran ceasefire, which sent crude oil prices lower and triggered $427 million in crypto short liquidations in a single day.
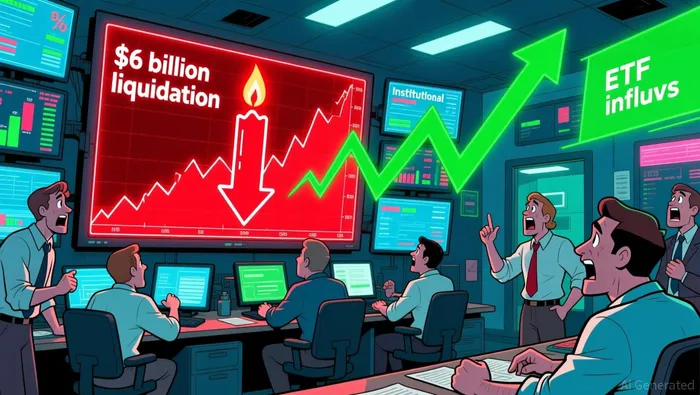
The price action now presses directly into the densest cluster of short liquidity in the market. Data shows $6 billion in leveraged positions are at risk of cascade liquidation near the $72,000-$73,500 range. This creates a potent structural pressure point where a break below could force a wave of forced selling, while a rebound might trigger a short squeeze.
The setup is a classic flow battle. On one side, spot Bitcoin ETFs are adding a fresh institutional demand channel, with the new Morgan Stanley product launching on Tuesday. On the other, the market's extreme leverage and recent macro-driven volatility present a clear vulnerability. The coming days will test whether the $72k floor holds or if the leveraged risk triggers a deeper correction.
The Flow: ETF Inflows vs. Whale and Leverage Behavior
The immediate directional battle hinges on competing money flows. On the demand side, spot Bitcoin ETFs recorded their largest single-day inflow in six weeks, worth $471 million. This fresh institutional demand provides a tangible floor and a direct channel for capital, especially with the new Morgan Stanley product adding to the mix.
Yet this institutional push faces a wall of limited accumulation from the market's largest holders. Whale wallets (10,000+ BTC) recorded inflows for only the second week in 2026. This suggests the largest accumulators are not aggressively buying at current levels, which tempers the bullish narrative and indicates a wait-and-see stance from the most influential players.
The behavior in derivatives markets confirms the flow is spot-driven, not speculative. Funding rates are flat to slightly negative across major exchanges, with most token-margin rates between -0.01% and -0.02%. This lack of positive funding pressure shows traders are not aggressively betting on a near-term price surge, reinforcing that the ETF inflows are the dominant, non-leveraged demand channel right now.
The Catalysts: What to Watch for a Breakout or Breakdown
The immediate path depends on a few clear, measurable triggers. The primary near-term catalyst is whether the U.S.-Iran ceasefire holds. Its collapse last week provided a macro tailwind, crashing oil prices and triggering a wave of risk-on flows. A sustained ceasefire would likely lock in that easing narrative, supporting the current bounce. Its failure would re-ignite geopolitical risk and could quickly reverse the momentum.
For a bullish breakout, watch for sustained ETF inflows and a decisive move above the $75,000 range ceiling. The recent $471 million in ETF inflows is a strong institutional signal, but it needs to continue. A daily close above $75k would force more leveraged longs to cover and target the next major psychological level near $80,000. It would also signal that spot demand is overpowering the macro headwinds.
Conversely, monitor the $6 billion leveraged risk cluster. A sustained move above $73,500 would likely trigger a cascade of long liquidations, not short squeezes. This cluster is the market's most vulnerable point; a break above it would drain liquidity from the long side, potentially accelerating a deeper correction. The setup is binary: either the ETF flows force a breakout, or the leveraged risk triggers a breakdown.