

The scale of recent whale buying is unprecedented. Over the past 30 days, wallets holding 1,000 to 10,000 BTC added 270,000 BTC, marking the largest monthly accumulation since 2013. This massive flow has directly compressed exchange liquidity, with exchange reserves dropping to 2.21 million BTC, the lowest level since December 2017.
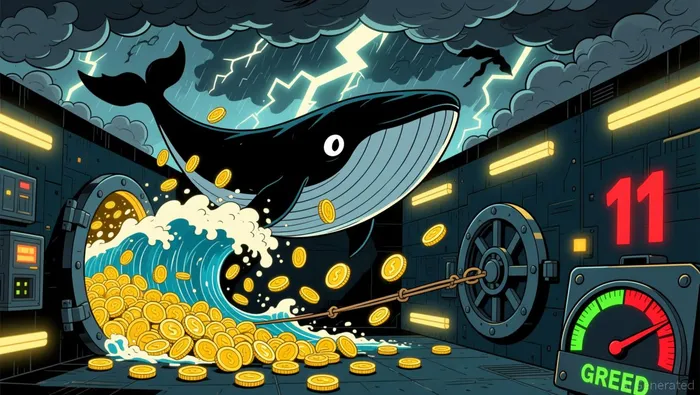
This accumulation is occurring against a backdrop of extreme market fear. The Fear & Greed Index hit an extreme reading of 11, with the index spending 46 consecutive days below 25. The data shows a classic divergence: while retail sentiment is frozen, the largest wallets are aggressively loading up, pulling supply off the most liquid venues.
The immediate price impact is a critical test. Bitcoin is currently pressing against a $73,868 resistance level that has capped every rally this month. The bullish signal from whale accumulation is clear, but the path to a breakout requires a decisive move above this zone, which would confirm the shift from fear to a new accumulation phase.
The Price Impact: Resistance and Flow Dynamics
The whale accumulation wave directly preceded and supported Bitcoin's rally to above $74,000. This buying surge has been a consistent flow, with spot market order sizes averaging 950 to 1,100 BTC throughout 2026-the most sustained period of large-ticket activity since September 2024. The data shows whales were accumulating ahead of the move, with their reserves climbing back to pre-October 2025 crash levels.
The rally now faces immediate pressure at a key resistance zone. Bitcoin's recent climb stalled near the realized price band at $76,800, a level that has historically capped bear market recoveries. This band acted as a ceiling in January 2026 before prices reversed lower, and analysts warn it could repeat if selling pressure builds. The immediate technical battleground is now between $75,000 and $76,000, where significant sell walls are testing the strength of the new buying.
A critical flow signal adds caution. Despite the whale buying, exchange inflows have spiked, with hourly inflows reaching nearly 11,000 BTC, the highest since late 2025. This pattern often signals holders preparing to sell. Furthermore, the share of large deposits in those inflows has jumped above 40%, a threshold historically aligned with stronger short-term selling pressure. The bullish thesis now hinges on whether the new buying can absorb this resistance and the profit-taking that follows.
Catalysts and Risks: Regulatory Clarity vs. Whale Sales
The immediate catalyst is regulatory. The SEC's CLARITY Act roundtable, scheduled for April 16, could provide the institutional adoption signal that has been missing. This event is a direct test of whether the current whale accumulation is being fueled by long-term conviction or is simply a prelude to a larger, more formalized market entry. Positive outcomes here could validate the bullish flow dynamics and encourage further accumulation.
The primary risk is a flood of long-term supply returning to market. A single 2013-era whale sold 1,000 BTC worth roughly $71.6 million this week, continuing a trend of dormant assets re-entering circulation. This selling pressure directly challenges the accumulation thesis, especially as Bitcoin faces the realized price band at $76,800. The market must now absorb both this potential new supply and the profit-taking from recent rallies.
The key flow metric to watch is the net exchange balance. While gross whale inflows have hit 14-month highs, the net effect depends on whether this buying offsets the strong outbound transfers from exchanges. If the net balance remains stable or declines, it signals the accumulation wave is holding. A reversal, where outflows dominate, would indicate a shift in whale sentiment and could break the current support structure.