

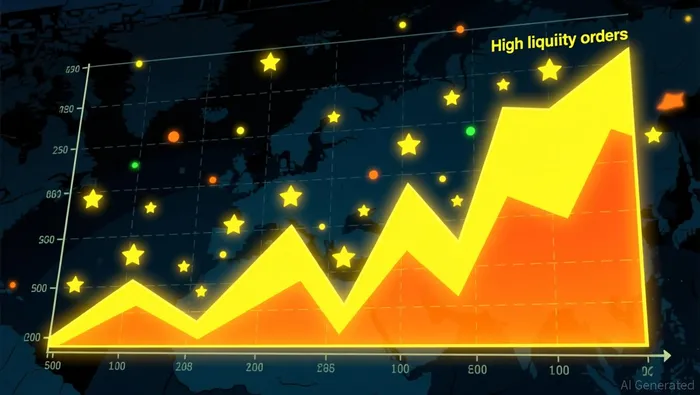
The spot CVD data from May 18 shows retail-driven accumulation underpinning the $67K–$68K range, with the yellow line tracking $100–$1,000 orders trending gradually upward while large orders ($1M–$10M) stayed flat. This divergence between small and large order flow is the raw signal: retail buyers are stepping in steadily, but institutional capital is not following. The brown line for large orders remained relatively flat, indicating institutional activity was more cautious or evenly balanced between buying and selling during the observation period.
The volume heatmap reveals where liquidity is actually concentrated, with bright zones at $67,000 and $68,000 marking near-term support and resistance where a high volume of trades have occurred. These price points act as liquidity pools-traders should watch for breakouts or rejections at these levels, as they represent areas where order flow has historically clustered. The heatmap background brightens at those levels when price lingers, confirming they are active battlegrounds during periods of stable price action.
The 90-day Spot Taker CVD trajectory remains flat, confirming no sustained institutional accumulation is occurring according to CryptoQuant data. This absence of a sustained upward trend in large-order flow suggests the current price stability is being driven more by retail demand than by large-scale capital inflows-a cautious signal for traders watching for momentum. Without institutional participation, the range-bound behavior may persist until a new catalyst shifts the order flow balance.
Order Flow Divergence: Who's Actually Buying?
Retail accumulation is providing a floor under Bitcoin, but the absence of large order flow signals institutional investors are staying on the sidelines. The May 18 data shows the yellow line for $100–$1,000 orders trending gradually upward while large orders ($1M–$10M) stayed flat. This divergence suggests retail buyers are stepping in to support the $67K–$68K range, but without institutional capital following suit, the foundation remains shallow.
The divergence between rising retail CVD and flat large-order CVD is a cautionary pattern-retail-driven moves lack the capital depth to sustain breakouts. When small orders push price higher without institutional participation, the move often fizzes out once retail exhaustion sets in. The flat brown line for large orders indicates institutions were evenly balanced between buying and selling during the observation period, offering no directional conviction to fuel a sustained rally.
This structure mirrors May 8, when similar range-bound behavior emerged with $67K–$68K as the primary consolidation zone before directional moves. The volume heatmap from that period shows concentrated liquidity at those same levels acting as potential support and resistance, suggesting the market is cycling through familiar accumulation patterns. Traders should watch for whether large orders finally break flat-without that institutional signal, expect the range to hold until new capital arrives.
What to Watch: Breakout Triggers and Risk Levels
The primary catalyst for an upside breakout is a sustained rise in the large-order CVD-the brown line tracking $1M–$10M trades has remained flat while retail orders drove accumulation. Any sustained upward movement in this institutional flow signal would confirm large capital re-engagement and likely fuel a breakout above the $68K resistance zone. Traders should monitor for this shift in real-time, as it would invalidate the range thesis and signal a new directional move.
The key risk scenario is a breakdown below $67,000 support on increased selling volume. If the retail accumulation thesis fails and large orders turn net aggressive sellers, downside acceleration follows rapidly. This would represent a failure of the current range-bound structure and could trigger a swift move toward lower liquidity zones.
To confirm whether current accumulation is exchange-wide or platform-isolated, the Glassnode Spot CVD breakdown across exchanges will reveal the breadth of buying interest. If accumulation appears across multiple major exchanges simultaneously, the range thesis gains credibility. If it's concentrated on just one or two platforms, the setup is more fragile and prone to rapid reversal when liquidity shifts.