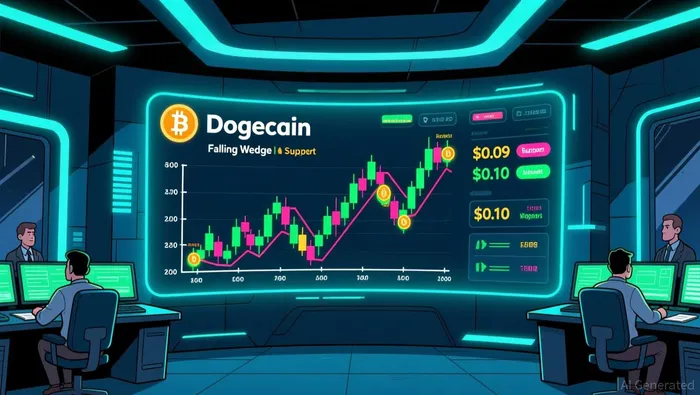
Dogecoin is trading within a classic Falling Wedge pattern on the weekly chart, a consolidation structure that has formed over the past year. This pattern, where price moves between two converging downward-sloping trendlines, is often seen as a bullish reversal setup if the prior trend was downtrending. The key support line of this wedge is now under direct pressure, while the upper resistance line is aligned with a long-term descending channel.
The immediate critical level is $0.09, a floor that has held for months but has seen repeated tests. Each retest weakens the support, making a break below a more serious risk. On the flip side, the key resistance to break is $0.10, which aligns with both horizontal price resistance and the descending channel's trendline. A decisive move above this level would signal a breakout from the channel and confirm the bullish wedge pattern.
The market is at a decisive point. A sustained break above $0.10 is needed to confirm the bullish setup and target higher levels near $0.12 or $0.15. Conversely, a failure to hold $0.09 would signal a bearish wedge failure, opening the door for a sharper drop toward $0.08 and deeper support.
Volume and Liquidity Flow
The market's conviction is currently in question. Despite a 24-hour trading volume of $1.67 billion, which provides ample liquidity for a breakout, the recent price action shows a clear bearish momentum. Dogecoin has fallen more than 9% over the last seven days, indicating that selling pressure is actively outweighing buying interest.
This creates a critical tension for the Falling Wedge pattern. A bullish breakout above $0.10 would require a surge in volume to confirm new buying conviction. Without it, the move could be a false signal. Conversely, a decisive break below the $0.09 support would likely see volume spike on the downside, accelerating the drop and confirming the bearish failure of the pattern.
The setup hinges entirely on which side volume supports. The current volume level is sufficient for sharp reversals in either direction, but the recent price decline suggests the bears are in control for now. Watch for volume to dry up on rallies or explode on breakdowns to gauge the true direction of the wedge's eventual resolution.
Catalysts and Key Watchpoints
The immediate catalyst is a daily close above $0.10. This level is the key resistance that aligns with the top of the descending channel and horizontal price resistance. A confirmed break above it would signal a channel breakout and validate the bullish Falling Wedge pattern. The first price target in that scenario is the $0.12 area, with a move toward $0.15 possible if momentum builds.
The primary bearish trigger is a break and close below the $0.09 support level. This floor has held for months but has been repeatedly tested, weakening its strength. A decisive close below it would signal a bearish wedge failure and open the door for a sharper decline. The next major support is at $0.08, with the deeper $0.088 zone also acting as a potential floor for a drop.
Monitor the 1-week RSI and MACD indicators for divergence from price. The current weekly RSI sits at 38.789, which is in neutral territory but not oversold. If price makes a new low while the RSI fails to make a new low, that divergence could signal weakening bearish momentum. Conversely, if price makes a new high while the RSI fails to confirm, it could warn of a loss of bullish conviction. These signals will help gauge whether the consolidation is building for a breakout or a breakdown.