
Summary
• KLAC opens at $1909.73 and trades as low as $1869.999, a 3.36% drop from previous close of $1935.00.
• RSI stands at 85.45, signaling potential overbought reversal.
• MACD at 94.75 with positive histogram suggests short-term momentum but diverges from price.
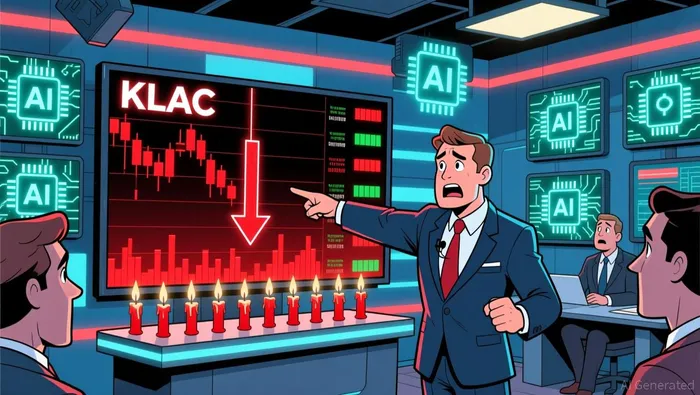
KLA Corp’s (KLAC) sharp decline has sent ripples through the semiconductor sector. A volatile day has traders on edge, with the stock trading well below its 52-week high. With rising macroeconomic uncertainty and the broader semiconductors sector facing headwinds, KLAC’s move is raising questions about the sustainability of its long-term trend.
Short-Term Profit-Taking Amid AI-Driven Optimism
KLAC’s drop today reflects a short-term profit-taking move by traders who had bought into the long-term bull case for the stock. Despite a still-bullish technical setup — including a short- and long-term bullish K-line pattern — the stock is correcting after a recent run-up. The 52-week high is just $1939.36, and with the stock trading at $1870, it’s evident that the correction is unfolding within a broader consolidation phase. The sector, however, remains on solid footing, supported by AI-driven demand for semiconductors, though investors are now hedging short-term risk.
Semiconductors Sector Mixed As AI Optimism Meets Profit-Taking
The semiconductor sector has been caught between strong AI-led optimism and short-term profit-taking. ASML, the sector leader, fell 2.30% intraday, mirroring KLAC’s broader trend. This suggests KLAC is not moving in isolation, but is instead part of a broader sector-wide correction as investors take off the table some of the recent gains made on AI-related hype. Other players like ON Semiconductor and MaxLinear are also seeing mixed performance, with no clear directional bias emerging beyond short-term volatility.
ETF and Technical Playbook for KLAC’s Key Levels
• MACD: 94.75 (bullish divergence from price)
• RSI: 85.45 (overbought, potential reversal zone)
• Bollinger Bands (Upper): 1985.83 (Resistance zone)
• 200D MA: 1238.87 (far below current price, long-term bullish)
• Support/Resistance (30D): 1470.97–1482.02 (historical support unlikely to hold in short term)
KLAC is trading at a critical inflection point where its long-term bullish pattern is being tested. The RSI overbought condition hints at a possible pullback, but the bullish K-line and MACD suggest buyers are still active. The Leverage Shares 2X Long KLAC Daily ETF (KLAG) is down 4.91% today, amplifying KLAC’s move and offering leveraged exposure to its short-term volatility. Investors should closely watch the 1926.77 intraday high as a key resistance level — if it breaks again, a retest of the 1939.36 52-week high could be in play. Conversely, a break below the 1869.99 level would trigger a deeper pullback toward the 1615.21 30D MA.
Given the absence of options data, technical indicators remain the key for assessing next steps. Aggressive bulls may consider a breakout above $1930 as a catalyst for re-entry.
Now Is the Time to Define a Tactical Play — Watch the 1930 Mark
KLAC’s recent pullback is a textbook example of a long-term bull trend being tested by profit-taking and overbought conditions. While the RSI suggests a potential near-term reversal, the broader technicals and sector support remain intact. ASML’s -2.30% move is a bellwether — if it stabilizes, it could signal renewed confidence in the semiconductor narrative. Investors should focus on two key levels: the 1926.77 intraday high and the 1930 psychological level. A break above $1930 could reignite the upward trend, while a breakdown below $1869 would open the door to further testing of the 30D and 200D moving averages. The key takeaway is clear: define your risk and watch the 1930 mark — it could be the breakout play of the week.