

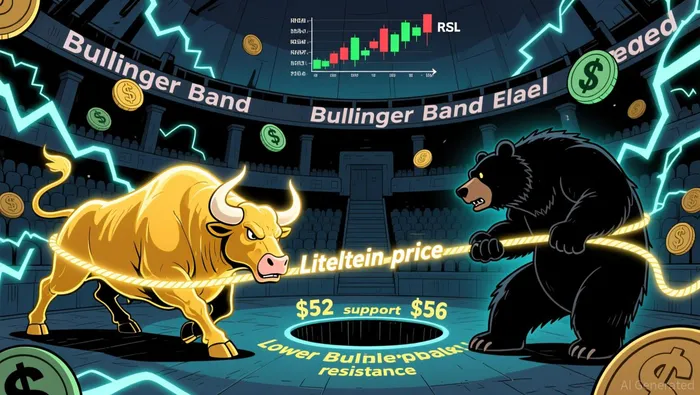
The immediate technical battleground for Litecoin is a tight squeeze between two key zones. Bulls are eyeing a decisive break above key resistance at $55.96, with the upper Bollinger Band at $56.63 acting as the final hurdle. On the flip side, bears are guarding the critical support level at $52.12, with the lower Bollinger Band at $52.14 providing a hard floor. This creates a clear range: the price is caught between $55.96 and $56.63 resistance and $52.12 to $53.72 support.
The momentum picture is neutral, not a green light for either side. The RSI reading of 45.94 sits right in the middle, showing neither overbought nor oversold conditions. This neutrality is the setup for a breakout. For the bulls to win, they need to push price decisively above $56.63 with volume to confirm the move. That would flip the supply/demand dynamic, signaling buyers have taken control. Failure to hold that level, however, risks a deeper drop toward the $52 support. A break below $52.12 would likely trigger accelerated selling, targeting the lower Bollinger Band and beyond. The battle lines are drawn; the next move will test which zone holds.
Volume Check: Is the Bullish Breakout Real?
The setup is clear, but the conviction is missing. For the bullish breakout to $58-$62 to hold, it needs a surge in volume to confirm buyer conviction. Right now, that volume isn't there. The price is stuck in a range, and without a decisive move above $56.63 with heavy volume, the move looks more like a false signal than a trend change.
The weekly chart shows a local uptrend, giving bulls a foothold. But zoom out to the daily, and the picture is starkly different. Litecoin remains firmly in a global bearish trend, trading far below its key moving averages. The 20-day SMA at $54.28 acts as immediate resistance, while the 200-day SMA at $77.51 is a distant, bearish ceiling. This conflict between short-term sentiment and long-term structure creates a high-risk environment. A breakout above $56.63 would need to overcome this deep-seated bearish momentum, which requires more than just a few buyers-it needs a volume wave.
On-chain data reveals a troubling split. Whale transactions are at a 5-week high, signaling accumulation. Yet, development activity is stagnant, and retail volume remains low. This is a classic sign of a lack of broad-based momentum. Whales are buying, but the crowd isn't following. In technical terms, this is a "buy the rumor, sell the news" setup in reverse. The rumor (whale accumulation) is building, but the news (retail participation) hasn't arrived to fuel a sustained rally.
The bottom line is one of supply and demand imbalance. The bullish target range of $58 to $62 is only reachable if the volume profile shifts dramatically. Without that surge, the price will likely face renewed selling pressure as the bears defend the $56.63 resistance. The current technical battle is a tug-of-war between a local uptrend and a powerful global downtrend, and volume will be the deciding factor. For now, the lack of conviction suggests a pullback is more likely than a breakout.
Catalysts and Targets: What Moves the Price
The next move hinges on specific triggers. The strongest signal for a bullish breakout is a clean, volume-supported break above the upper Bollinger Band at $56.63. That level is the technical key. A close above it would confirm the bulls have seized control, flipping the supply/demand dynamic and targeting the $58 to $62 range within weeks. The LitVM testnet launch on April 15 is a high-risk catalyst. If it sparks real developer activity and DeFi adoption, it could provide the narrative fuel for a move. But as a new, unproven ecosystem, its impact is speculative and could easily be ignored by the market.
The main risk is failure to hold the $52 support. A decisive break below $52.12 would likely trigger accelerated selling, as bears defend the lower Bollinger Band at $51.94. This would accelerate the bearish momentum, with the $54.28 20-day SMA acting as a key dynamic level that could turn into resistance on the way down. The $50 level becomes the next major test in that scenario.
For now, the setup is binary. Watch for the volume surge that confirms a break above $56.63. Without it, the price is likely to face renewed selling pressure. The $54.28 SMA is the immediate battleground. A failure to hold it would confirm the bearish structure, while a sustained move above it would be the first step toward the $58-$62 target.