

The market is still pricing gold miners on ounces produced. The miners are pricing their businesses on dollars earned - and the gap between those two stories is widening into something worth noticing.
Gold hit $5,608 an ounce in January. It has since pulled back to roughly $4,200. The GDX gold miners ETF is down nearly 10% year-to-date. The headlines tell you to worry about declining production: Newmont guided to 5.26 million ounces for 2026, down from 5.89 million in 2025. Barrick saw a 5% year-over-year dip in Q1 output.
The headlines say shrinkage. The cash-flow path says record harvest.
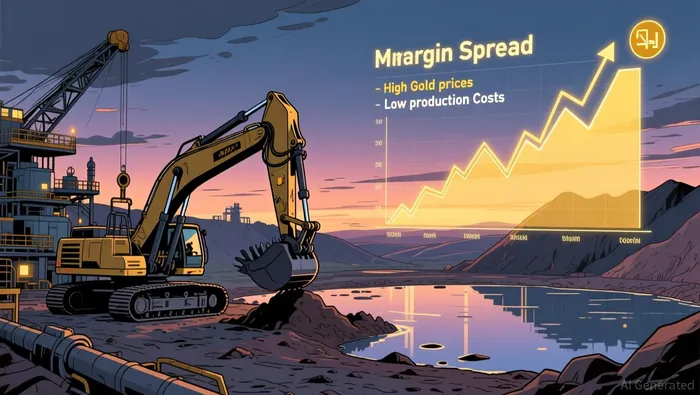
This is not about excitement. It is about a margin spread that few sectors in global markets can currently replicate.
The spread that matters
Gold miners report something called AISC - all-in sustaining costs - which is the per-ounce cost to mine, operate, and sustain the mine at current production levels. It is the closest thing to a true cost floor.
Newmont's AISC for 2026 sits around $1,680 per ounce. Barrick's is closer to $1,475. Gold is trading near $4,200. That leaves a spread of roughly $2,500 to $2,700 per ounce - roughly $2,800 if you round and use the broader industry midpoint.
That spread is what flows to the bottom line. And it does not care that production is down 10%. It multiplies whatever volume is left by a number that has never been this large for this long. The result: Newmont generated $7.3 billion in free cash flow for all of 2025 - up 79% quarter-over-quarter at the peak - and hit $3.1 billion in Q1 2026 alone, a record quarter.
Few businesses in any sector are printing that much cash while trading at 13 times earnings. Newmont's market cap sits around $107 billion. The stock sits near $100.
Why the market is still anchored to volume
There are two reasons. First, the instinct to count ounces is baked into gold mining. It has been the primary scorecard for decades. When gold trades at $1,800, every ounce matters because the margin above cost is thin. That mental model has not unspooled even though the price environment has completely changed.
Second, the production decline is real, and it gives skeptics a concrete excuse to stand aside. Newmont's near-term volume drop is tied to mine transitions and development spending - $1.4 billion in 2026 capital expenditures for projects that will feed later production cycles. It is a timing mismatch, not a resource problem. But the tape doesn't distinguish between temporary and structural.
This creates the exact dynamic worth paying attention to: the numbers have already turned while the consensus is still working through the old metric.
The supply backdrop makes it worse for sellers
Central banks bought a net 244 tonnes of gold in Q1 2026 alone - the strongest start to any year on record. At the same time, mine supply growth is constrained by longer permitting timelines and higher project costs that have made new production painfully slow to come online. J.P. Morgan sees gold potentially reaching $5,000 to $6,000 per ounce later this year. ING forecasts an average of $4,325.
None of these are guarantees. But the point is not to predict where gold ends up. The point is that even if gold flat-lines at $4,000, the spread above miner costs stays enormous. A $2,300-to-$2,500 per-ounce margin is still extraordinary for an industry with $1,500-to-$1,700 costs.
The math
Newmont at $107 billion market cap, 13 times trailing earnings, generating $7+ billion in annual free cash flow, with a cost structure that keeps roughly $2,500 of every ounce sold - that is not a stock pricing in decline. That is a stock pricing in caution.
If you apply a forward multiple of 16 to 18 times on next-twelve-month earnings - which is still below what the market gave gold miners during the last bull phase in 2011-2012, and below what it pays many lower-margin industrial businesses right now - the implied range is roughly $115 to $130 per share. That represents 15% to 30% upside from current levels over the next 12 to 18 months.
I can be wrong again. It has really humbled me, more than once. But the setup here is specific: the margin spread is structural as long as costs stay where they are, and the valuation is not reflecting the cash the business is already generating.
What could break this
Gold falls hard - below $3,000 per ounce - and the margin compression is real enough to cut free cash flow below $5 billion at Newmont. That would suggest the pullback is not a pause but a regime change.
Alternatively, cost inflation accelerates faster than expected. AISC guidance creeps toward $2,000 per ounce or above, narrowing the spread faster than the market expects. Watch Newmont's quarterly AISC reports. If they breach $1,900 on a by-product basis, the thesis starts to fray.
Production declines prove structural rather than transitional - meaning Newmont's 2026 guidance cuts deeper and the development capex isn't converting into future volume. In that case, the volume decline was the real story after all.
Tripwire: if gold closes below $3,000 on a weekly basis and Newmont's trailing twelve-month free cash flow drops below $5 billion, the spread thesis is broken. Cut the position. Discipline over ego.
The broader point is simpler than any of the noise around SpaceX valuations or attention economics. While the market counts ounces and worries about production dips, the miners are sitting on a cost-price spread that has never been this wide, generating record cash, and trading at a multiple that doesn't reflect what they're already doing. The gap between the old story and the new numbers is the setup.