

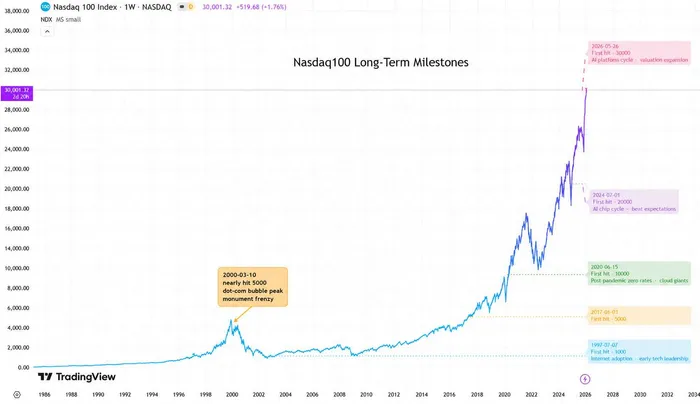
On May 26, 2026, the Nasdaq 100 Index officially crossed the 30,000 threshold for the first time in Wall Street history. Propelled predominantly by dominant technology sector leaders and relentless artificial intelligence commercialization, this event forces global market participants to confront a critical question: after crossing such a massive round-number milestone, will the market continue its relentless rally, or is it destined for high-level consolidation? Historically, psychological barriers of this magnitude generate acute near-term volatility. However, the foundational outlook remains cautiously optimistic. Because the current valuation expansion is supported by tangible earnings upgrades in the semiconductor and software sectors, the long-term secular growth trajectory appears intact, making this milestone a structural progression rather than a speculative peak.
Tracing The Ascent: From 10,000 to 20,000
The journey to current levels required absorbing significant macroeconomic regime changes. The index first closed above 10,000 in June 2020, heavily supported by pandemic-era economics, including zero-interest-rate policies, infinite quantitative easing, and a massive surge in demand for cloud computing and remote work platforms. Transitioning from 10,000 to 20,000 required approximately four and a half years. This subsequent 20,000 milestone was breached by late 2024, catalyzed by falling inflation, anticipation of 2025 rate cuts, and significant corporate earnings upward revisions tied to AI hardware and large language models. According to Ainvest analysis, long-term charting reveals that despite experiencing severe inflation shocks and aggressive rate hike cycles between these markers, the broader tech index consistently extracted immense value from the prevailing artificial intelligence thematic.
Event Study: Post-Milestone Performance Metrics
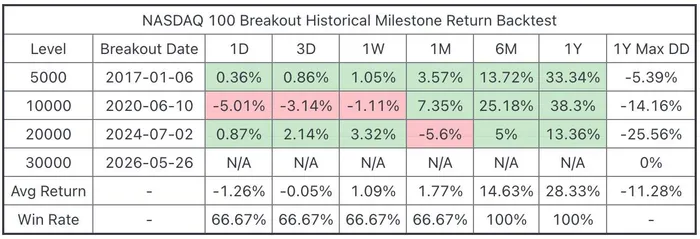
Psychological resistance levels often trigger immediate capital reallocation. Analyzing the backtest data for previous major breakouts reveals distinct performance patterns. Short-term reactions display mixed results, with average returns dipping into negative territory, such as a -1.26% average return for the 1-day timeframe. Notably, the 10,000 breakout in 2020 saw a 1-week decline of -1.11%, while the 20,000 milestone experienced a 1-month drawdown of -5.6%. However, the intermediate to long-term data presents a decisively bullish framework. For the 6-month and 1-year windows following the 5,000, 10,000, and 20,000 breakouts, the win rate stands at an absolute 100%, generating an average 1-year return of 28.33%.
Valuations and Fundamentals: Is 30,000 Dangerously Overextended?
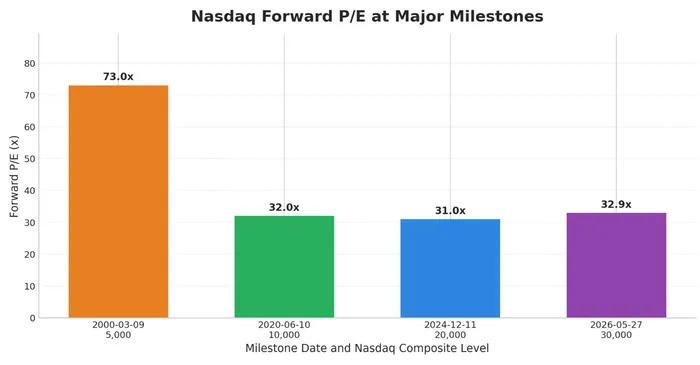
The core analytical debate now shifts to whether this 30,000 level represents an over-extension of AI expectations. According to Ainvest analysis, forward price-to-earnings (P/E) distributions present a stabilizing narrative. The forward P/E currently sits at 32.9x. This is fundamentally consistent with the 32.0x valuation seen at the 10,000 mark in 2020 and the 31.0x metric at the 20,000 mark. Crucially, it remains drastically lower than the monumental 73.0x valuation frenzy witnessed near the 5,000 peak during the March 2000 dot-com bubble. While past valuations were supported by imminent digital transition revenues, the 30,000 milestone relies heavily on how much speculative AI infrastructure investment has translated into actual, verifiable profit margins rather than mere multiple expansion.
However, structural vulnerabilities remain prominent. The market faces extreme concentration risk; the top 10 constituent stocks account for a disproportionate weighting, meaning any synchronized tech correction would devastate index-level performance. Furthermore, macroeconomic threats persist regarding rate trajectory disappointments and persistent inflation that could force sudden multiple compression. Additionally, looming antitrust scrutiny and AI regulatory frameworks present localized risks for major technology components.
Conclusion
Ultimately, round-number milestones routinely generate short-term emotional extremes and heightened volatility, yet historical event studies confirm they rarely represent definitive structural tops. Moving forward, long-term market performance will be dictated by tangible earnings realization and underlying liquidity conditions, rather than psychological integer levels. This 30,000 threshold simply marks another step in market progression.