

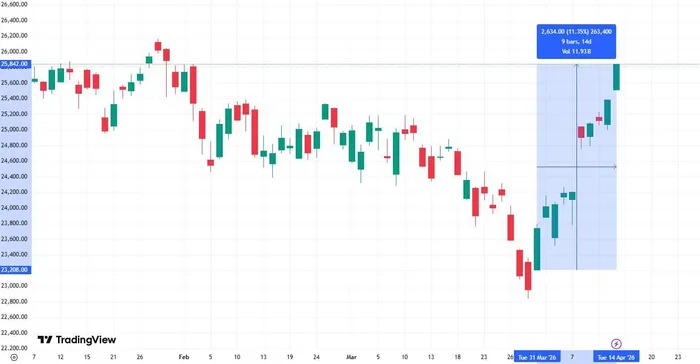
The U.S. equities market has executed a profound reversal in recent weeks. Following a steep correction triggered by the outbreak of the Middle Eastern conflict, the Nasdaq Composite has staged an aggressive recovery, completing a rare 10-Consecutive-days winning streak. By April 14, 2026, the index accumulated an 11.35% gain, erasing war-time losses and allowing technology stocks to resume their leadership position. This sharp pivot materialized as geopolitical negotiations progressed and President Donald Trump indicated the conflict could conclude swiftly. But how does this extreme, rapid rebound compare to historical market surges? From a macroeconomic perspective, this momentum is a robust positive signal, backed by fundamental earnings in the technology sector, yet it demands structural caution regarding near-term overextensions.
From Escalation to Relief: Tracing the 10-Day Market Pivot
Market sentiment was further bolstered today as Donald Trump repeatedly hinted that the ongoing war would be ending "very soon," catalyzing the final leg of the Nasdaq's 10-day consecutive surge. To understand this 11.35% expansion, evaluating the chronological shift in risk pricing over the past several weeks is essential. According to Ainvest analysis, the market's trajectory can be divided into three distinct behavioral phases.
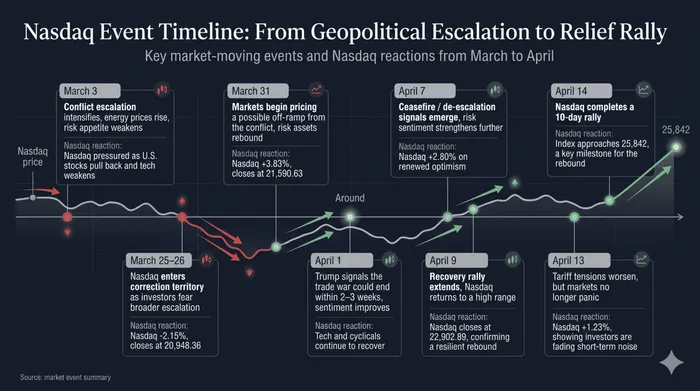
- The Risk Release Phase (March): As the conflict initially escalated, energy prices spiked, and risk appetite deteriorated rapidly. By late March, the Nasdaq officially entered correction territory, culminating in a severe 2.15% single-day drop on March 25 to close at 20,948.36. At this juncture, the market was heavily pricing in broader conflict contagion, energy supply shocks, and the deleveraging of risk assets.
- The Expectation Shift Phase (Late March to Early April): The narrative decisively pivoted on March 31, when the index jumped 3.83% to 21,590.63, indicating institutional capital was beginning to price in a "war exit" scenario rather than continued escalation. This was reinforced around April 1, when Trump suggested the war could end within two to three weeks, establishing a clear emotional inflection point for technology and cyclical equities.
- The Confirmed Rally Phase (Mid-April): By April 7, tangible ceasefire signals emerged, driving the Nasdaq up 2.80%. The recovery proved structurally sound by April 9, reaching 22,902.89, transitioning from a headline-driven bounce to a trend-driven recovery. Remarkably, even when negotiations temporarily stalled on April 13, the index climbed 1.23%, demonstrating that the broader trend had decoupled from short-term geopolitical noise. This culminated on April 14, with the index reaching roughly 25,842 to finalize the 10-day winning streak.
What Happens After a Nasdaq 10-Day Winning Streak? Historical Data Analysis
While a 10-day consecutive rally exceeding 11% feels unprecedented, historical data provides a quantitative roadmap. According to Ainvest analysis, examining identical setups—specifically the Nasdaq gaining over 11% across 10 consecutive positive sessions—reveals a highly favorable forward-looking bias.
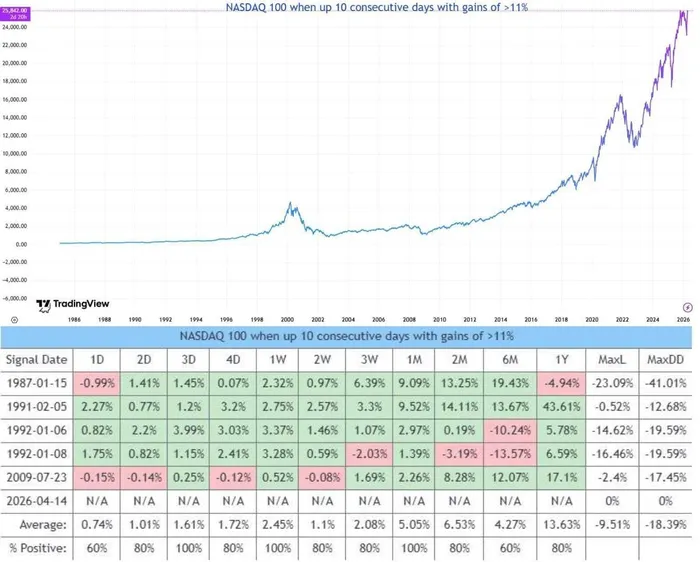
The backtested performance metrics suggest that extreme rapid recoveries generally act as a precursor to sustained bullish momentum. On a one-year horizon following the signal date, historical analogs exhibited an 80% probability of positive returns, with an average 12-month gain of 13.63%. Medium-term performance is similarly robust, boasting an average two-month return of 6.53% and a six-month return of 4.27%.
However, the data also highlights severe intermittent risk. Across the historic sample, the average maximum drawdown following these signals was an extensive -18.39%. This indicates that while the one-year destination is historically higher and the overall win rate is solid, the journey often involves deep, punishing pullbacks that can severely impact over-leveraged portfolios.
Nasdaq’s 10-Day Rally: A Sustainable Opportunity or a Dangerous Bull Trap?
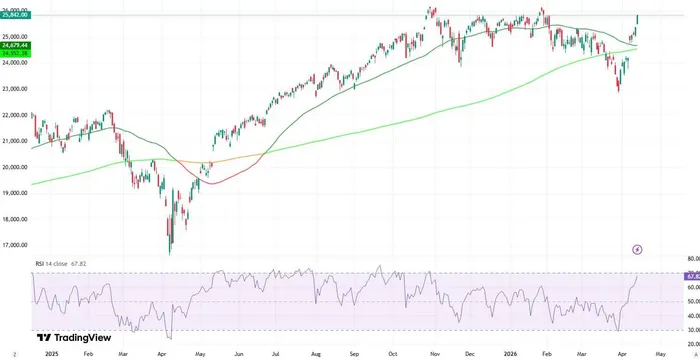
Is this wartime rebound a generational buying opportunity or a liquidity trap? From a technical standpoint, caution is warranted in the immediate term. According to Ainvest analysis, the Nasdaq's Relative Strength Index (RSI) is hovering near 67.82, rapidly approaching the 70.00 overbought threshold. Furthermore, the index has stretched significantly above its moving averages, a dynamic that historically invites mean-reversion selling as the initial buying exhaustion sets in.
Despite these technical headwinds, the fundamental architecture of the rally remains anchored by the artificial intelligence sector. Mega-cap tech and AI-infrastructure equities have disproportionately contributed to the index's heavy lifting, proving that secular growth themes can overpower geopolitical risk premiums once tail-risks subside. Major Wall Street institutions have taken note; reports from major financial networks indicate that prominent investment banks are increasingly encouraging clients to "buy the dip," arguing that the combination of resilient corporate earnings and receding macro-uncertainty provides a favorable risk-reward ratio for equities moving forward.
Conclusion
For investors, the recent 10-day surge should be interpreted as a decisive normalization of risk. Historical data heavily favors continued upside over the next 12 months, and the structural necessity of long-term AI investments provides a solid fundamental floor for the market. Nevertheless, trailing uncertainties regarding global energy supplies, interest rate adjustments, and latent geopolitical flashpoints remain highly relevant. Given the historical precedent of deep drawdowns following vertical moves, investors must exercise disciplined risk management; chasing absolute peak momentum carries the inherent danger of absorbing severe, albeit temporary, structural corrections.