

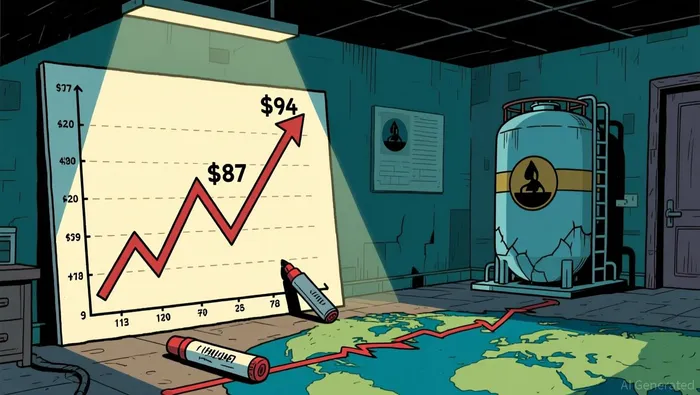
Brent crude hit $94.46 a barrel on June 11, the latest pop from renewed Israeli strikes on Iran and Iranian counter-strikes that threatened to shatter an already fragile ceasefire. Asian markets tumbled. U.S. futures tried to recover. The headline narrative is familiar: geopolitical shock, oil surges, stocks fall.
But the futures curve tells a different story - one that matters more for the retirement investor deciding whether to hold, trim, or rotate out of energy exposure.
The Curve vs. The Headline
Here is what the Brent futures curve looks like right now. September delivery: $92.55. October: $90.71. November: $89.11. December: $87.70. The curve is in backwardation, meaning near-term contracts trade at a premium to later ones because of the current supply disruption. But the slope is steep - the market is pricing roughly $7 per barrel off between today and year-end delivery.
Backwardation doesn't mean the market expects oil to stay at $94. It means the market expects oil to fall. Traders are willing to pay a premium for oil they need now, when Strait of Hormuz risk is live, but they aren't pricing a sustained war premium into the back months. The futures curve is the most honest forecast you have - it aggregates the expectations of every producer, consumer, and hedger in the market. They're pricing de-escalation.
Why the Spot Price Is Misleading
Brent spiked to nearly $107 in late March when the Strait of Hormuz - the chokepoint through which roughly 20% of global oil flows - faced closure threats. It has since pulled back 12.35% over the past month even as headlines keep the conflict alive. The June 7-8 flare-up added a fresh bump, but it hasn't changed the underlying structure.
On June 8, Iran and Israel both pledged to ease attacks that threatened to derail peace talks. Iran's armed forces announced the end of military operations against Israel, warning only of a "more crushing" response if strikes resume. The ceasefire hasn't held cleanly, but the trajectory is toward de-escalation, not total war. The spot price is front-running the headline; the futures curve is pricing the reality.
For the retirement portfolio, this distinction matters. If you're using energy as an inflation hedge or a diversifier - which it should be, given its historical inverse correlation to broader equity markets - you need to know whether the hedge is working because of structural value or because of a temporary fear spike. The curve says the latter is fading.
The SPR Drain
There's another headwind the headline cycle ignores. The U.S. Strategic Petroleum Reserve has dropped by roughly 50 million barrels since the war began - down to 365 million barrels, its lowest level in decades. The government lent crude to refiners to keep supply flowing during the worst of the disruption.
On June 5, companies will return 40 million barrels to the SPR after the Iran war ends. That is a supply overhang waiting to materialize. The SPR refill obligation will add barrels back into the market at the exact moment the war premium fades. The government isn't going to let the SPR stay depleted. When those barrels return, they'll put downward pressure on prices.
The Underlying Glut Returns
Before the war started, global supply would exceed demand by approximately 3.8 million barrels per day in 2026. That forecast was rendered moot by the conflict, but it isn't invalid. If the ceasefire stabilizes and Hormuz flows normalize, that surplus is still waiting in the wings.
The Brookings Institution noted in late May that temporary supply buffers are being depleted and the shortfall will build in coming months - but that analysis assumes the conflict persists. A sustained ceasefire flips the scenario. The pre-war glut forecast becomes relevant again, and fast.
The energy investor's risk isn't that oil collapses to pre-war levels overnight. It's that the backwardation unwinds gradually, and the spot price drifts down the curve toward $88-$87 - a level that may no longer support the valuation multiples that energy stocks are carrying today.
What This Means for Energy Exposure
The XLE energy ETF is up 29.19% year-to-date. That return has served the portfolio well: energy has been the diversifier that worked while growth stocks faced interest rate pressure and AI valuation concerns. The hedge did its job.
But a hedge that has returned 30% in six months needs the same scrutiny you'd apply to any position that has run. The question isn't whether energy is a good portfolio sleeve - it is, and it should be part of every retirement allocation. The question is whether you're buying the structural hedge or the war premium.
The futures curve suggests the war premium is still embedded in near-month prices. The SPR refill obligation adds a known supply headwind. The ceasefire, while fragile, is moving in one direction.
For retirement portfolios with existing energy exposure: hold, but watch the curve. If Brent drifts toward the $88-$87 level that the back-month contracts are already pricing, the thesis shifts from "hedge that's working" to "position that's caught between peaking and normalizing." That's when you reassess.
For portfolios without energy exposure: this isn't the entry point. A spike-driven rally in a backwardation market is not the same as a structural re-rating. Wait for the curve to flatten and the spot price to converge. If the ceasefire holds, energy at lower multiples and $85-$88 oil will offer a cleaner entry for the long-term hedge.
Energy's role in a retirement portfolio is structural - it hedges inflation, it correlates inversely to growth stocks, it generates cash flows that don't depend on consumer sentiment. But the role is different from the trade. The curve says the trade is working itself toward completion. Don't mistake the two.