

Solana is trading near $86.23 after a 5.30% daily gain. The short-term momentum looks solid, with the price up 7.69% over seven days. Yet this near-term pop sits against a longer-term structural framework that defines the real battleground.
Zooming out, the governing trend is a long-term ascending channel. Within this channel, the key macro support level is $49, which sits in the mid-range and has held as the structural floor. The immediate macro resistance is $108, a level where SOL has repeatedly struggled to break and hold.
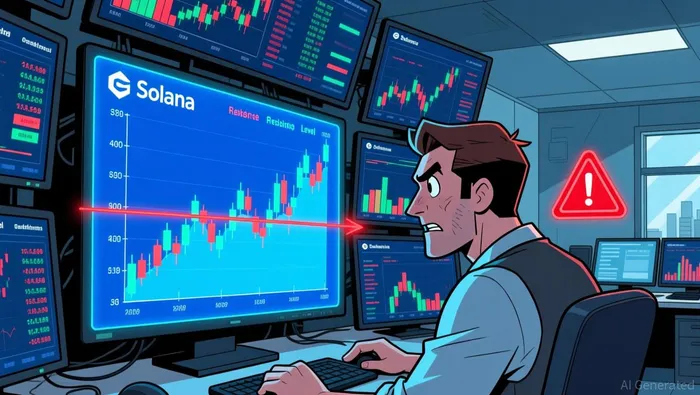
The critical tension is that $86 itself has been flagged as a critical threshold. Historically, failure to hold key levels on daily closes has limited gains. The test now is whether this rally can break above the $108 resistance or if it will be rejected, potentially triggering a retest of the $49 support. For now, the channel remains intact, but the path depends on clearing the immediate ceiling.
Liquidity and Volume: The Flow Behind the Move
The recent price surge is supported by robust trading volume, but the flow is showing signs of fatigue. Daily trading volume hit $5.43 billion, a strong figure that indicates significant market participation. However, this volume is down slightly from the prior day, suggesting the initial buying momentum may be cooling as the price approaches key resistance.
A critical metric for tracking leveraged flow is missing in real time. Open interest data for SOL futures is not updated live, making it difficult to gauge the buildup of speculative positions that often precede major moves. Without this visibility, it's harder to assess whether the rally is being fueled by fresh capital or simply rotation from other assets.
More broadly, Solana's performance this week is underwhelming. The token has declined 3% since Tuesday evening, underperforming both Bitcoin and Ethereum. This relative weakness, despite the daily volume spike, hints that the broader market is not aggressively rotating into SOL. For the rally to sustain, the volume needs to hold or expand, and the underperformance must reverse.
Catalysts and Risks: The Path to $49 or $108
The immediate test is clear: can SOL break above the $108 resistance? This level has been a recurring ceiling, where the asset has repeatedly failed to hold gains. A decisive daily close above $108 would signal a breakdown of this key supply zone and a potential shift toward the next major target within the ascending channel.
A more immediate risk lies below. A drop below the $80 support zone would invite significant selling pressure. This level is a critical short-term base; a clean break below it would weaken the current bullish structure and could trigger a retest of the deeper $75.38 and $71.92 supports. More broadly, a sustained move back toward the $49 channel floor would confirm a failure of the recent rally.
For a bullish continuation, the flow needs to confirm strength. A breakout above the $87.87–$89.75 supply zone would signal that buying pressure is overcoming immediate resistance. This would align with the macro channel framework, positioning SOL for another attempt at the $108 ceiling. The path forward hinges on which of these key levels holds.